
Follow these 9 simple steps for setup. (Notice the arrows in the images for easy navigation)
After installing the application and signing up, put in your aws account and then click "Generate Template"

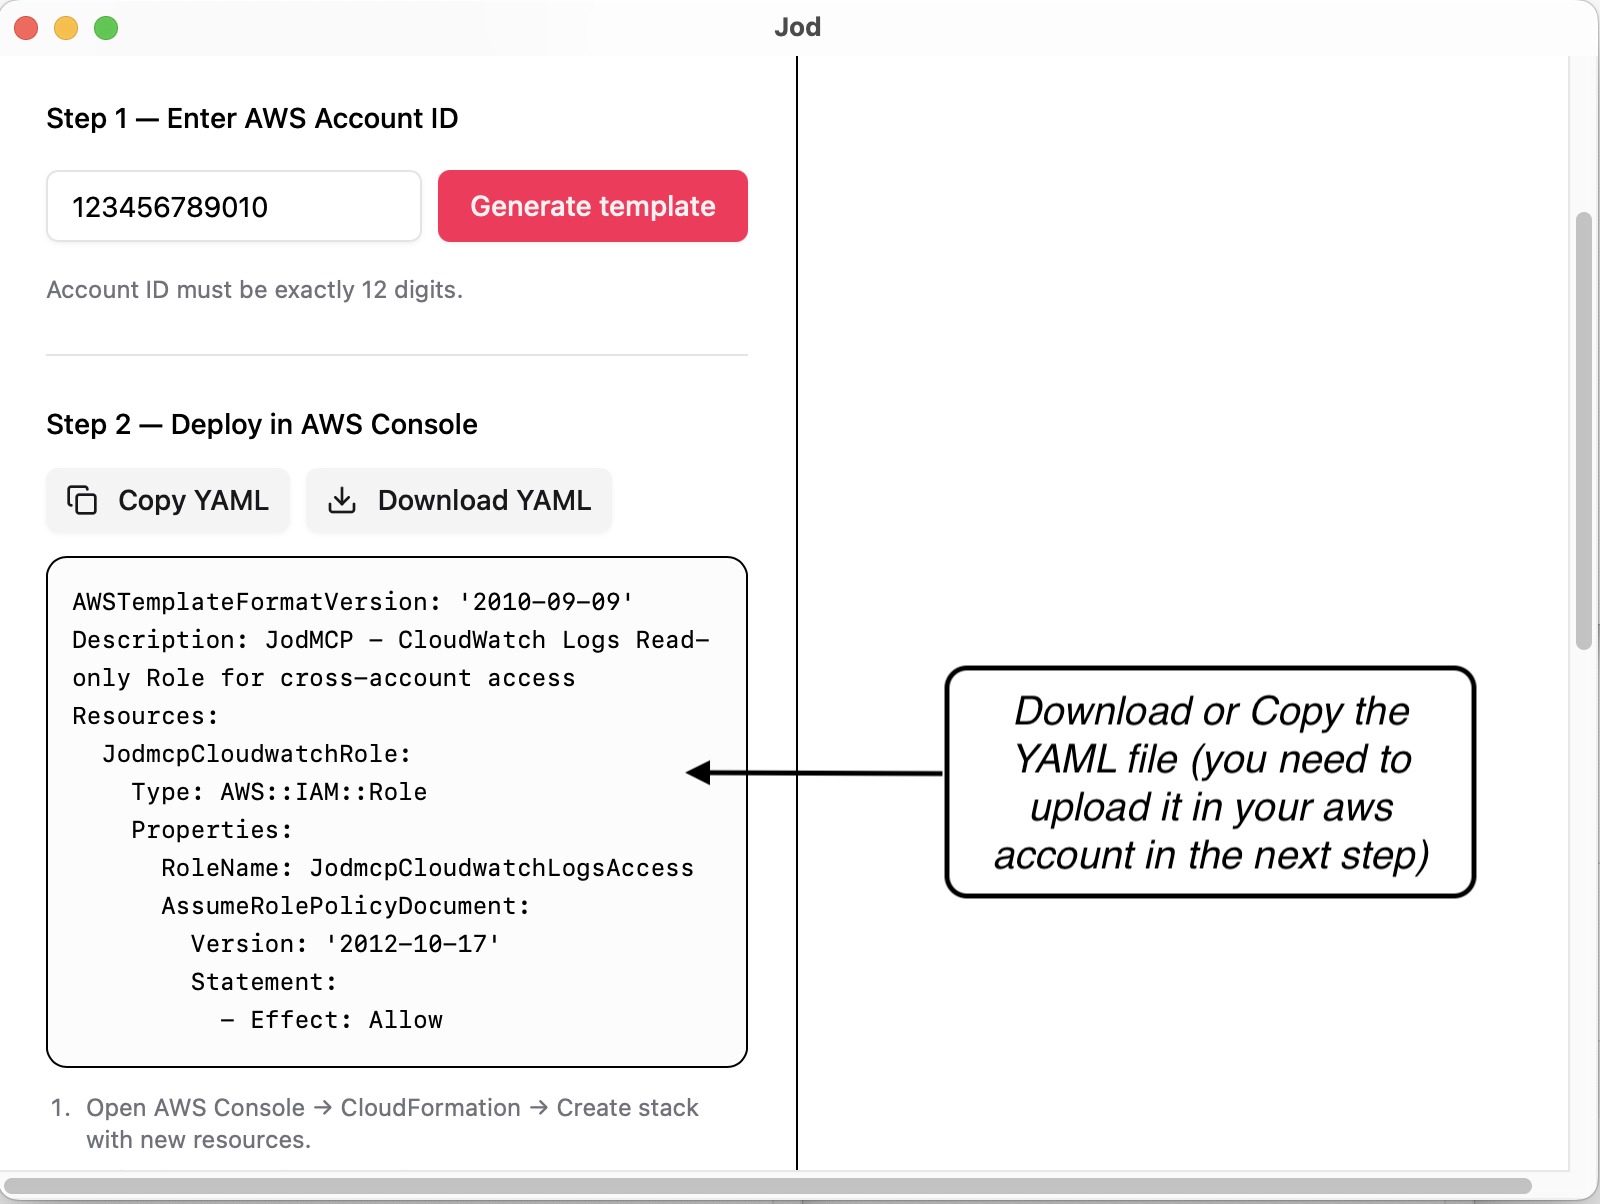
Download the YAML template. This helps Jod assume role within your cloudwatch logs and query it on your behalf later on.
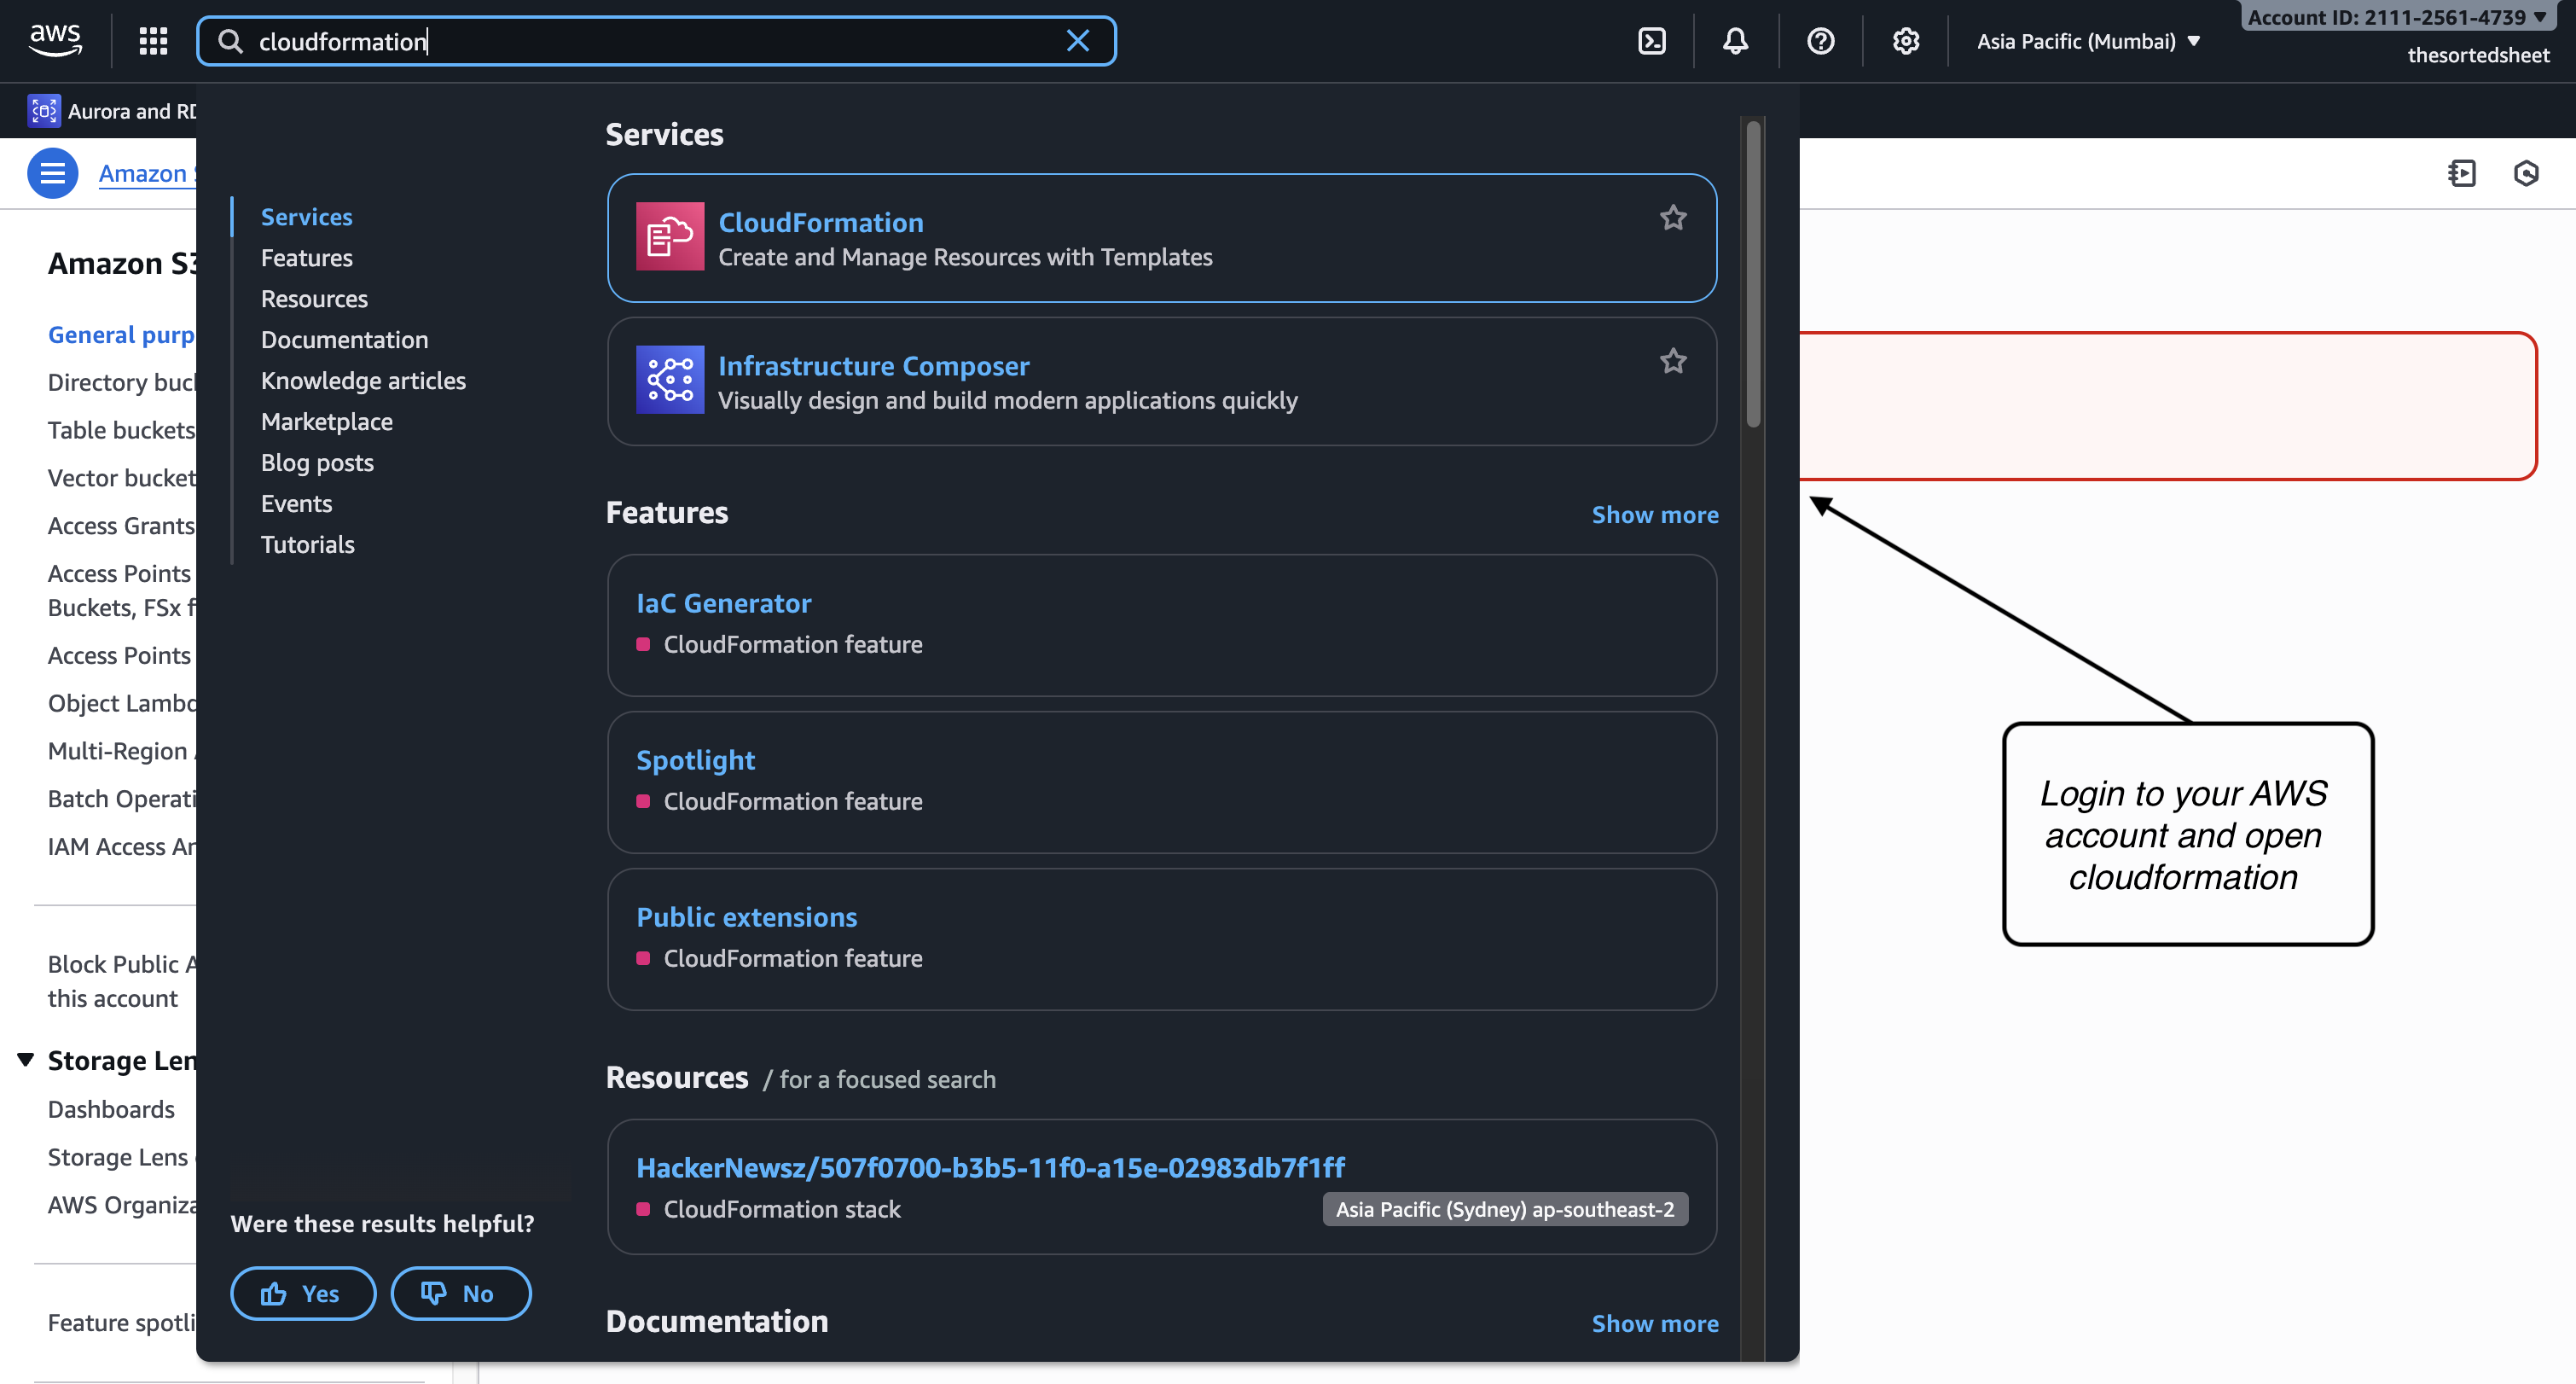
Login to your AWS account and navigate to the CloudFormation service.
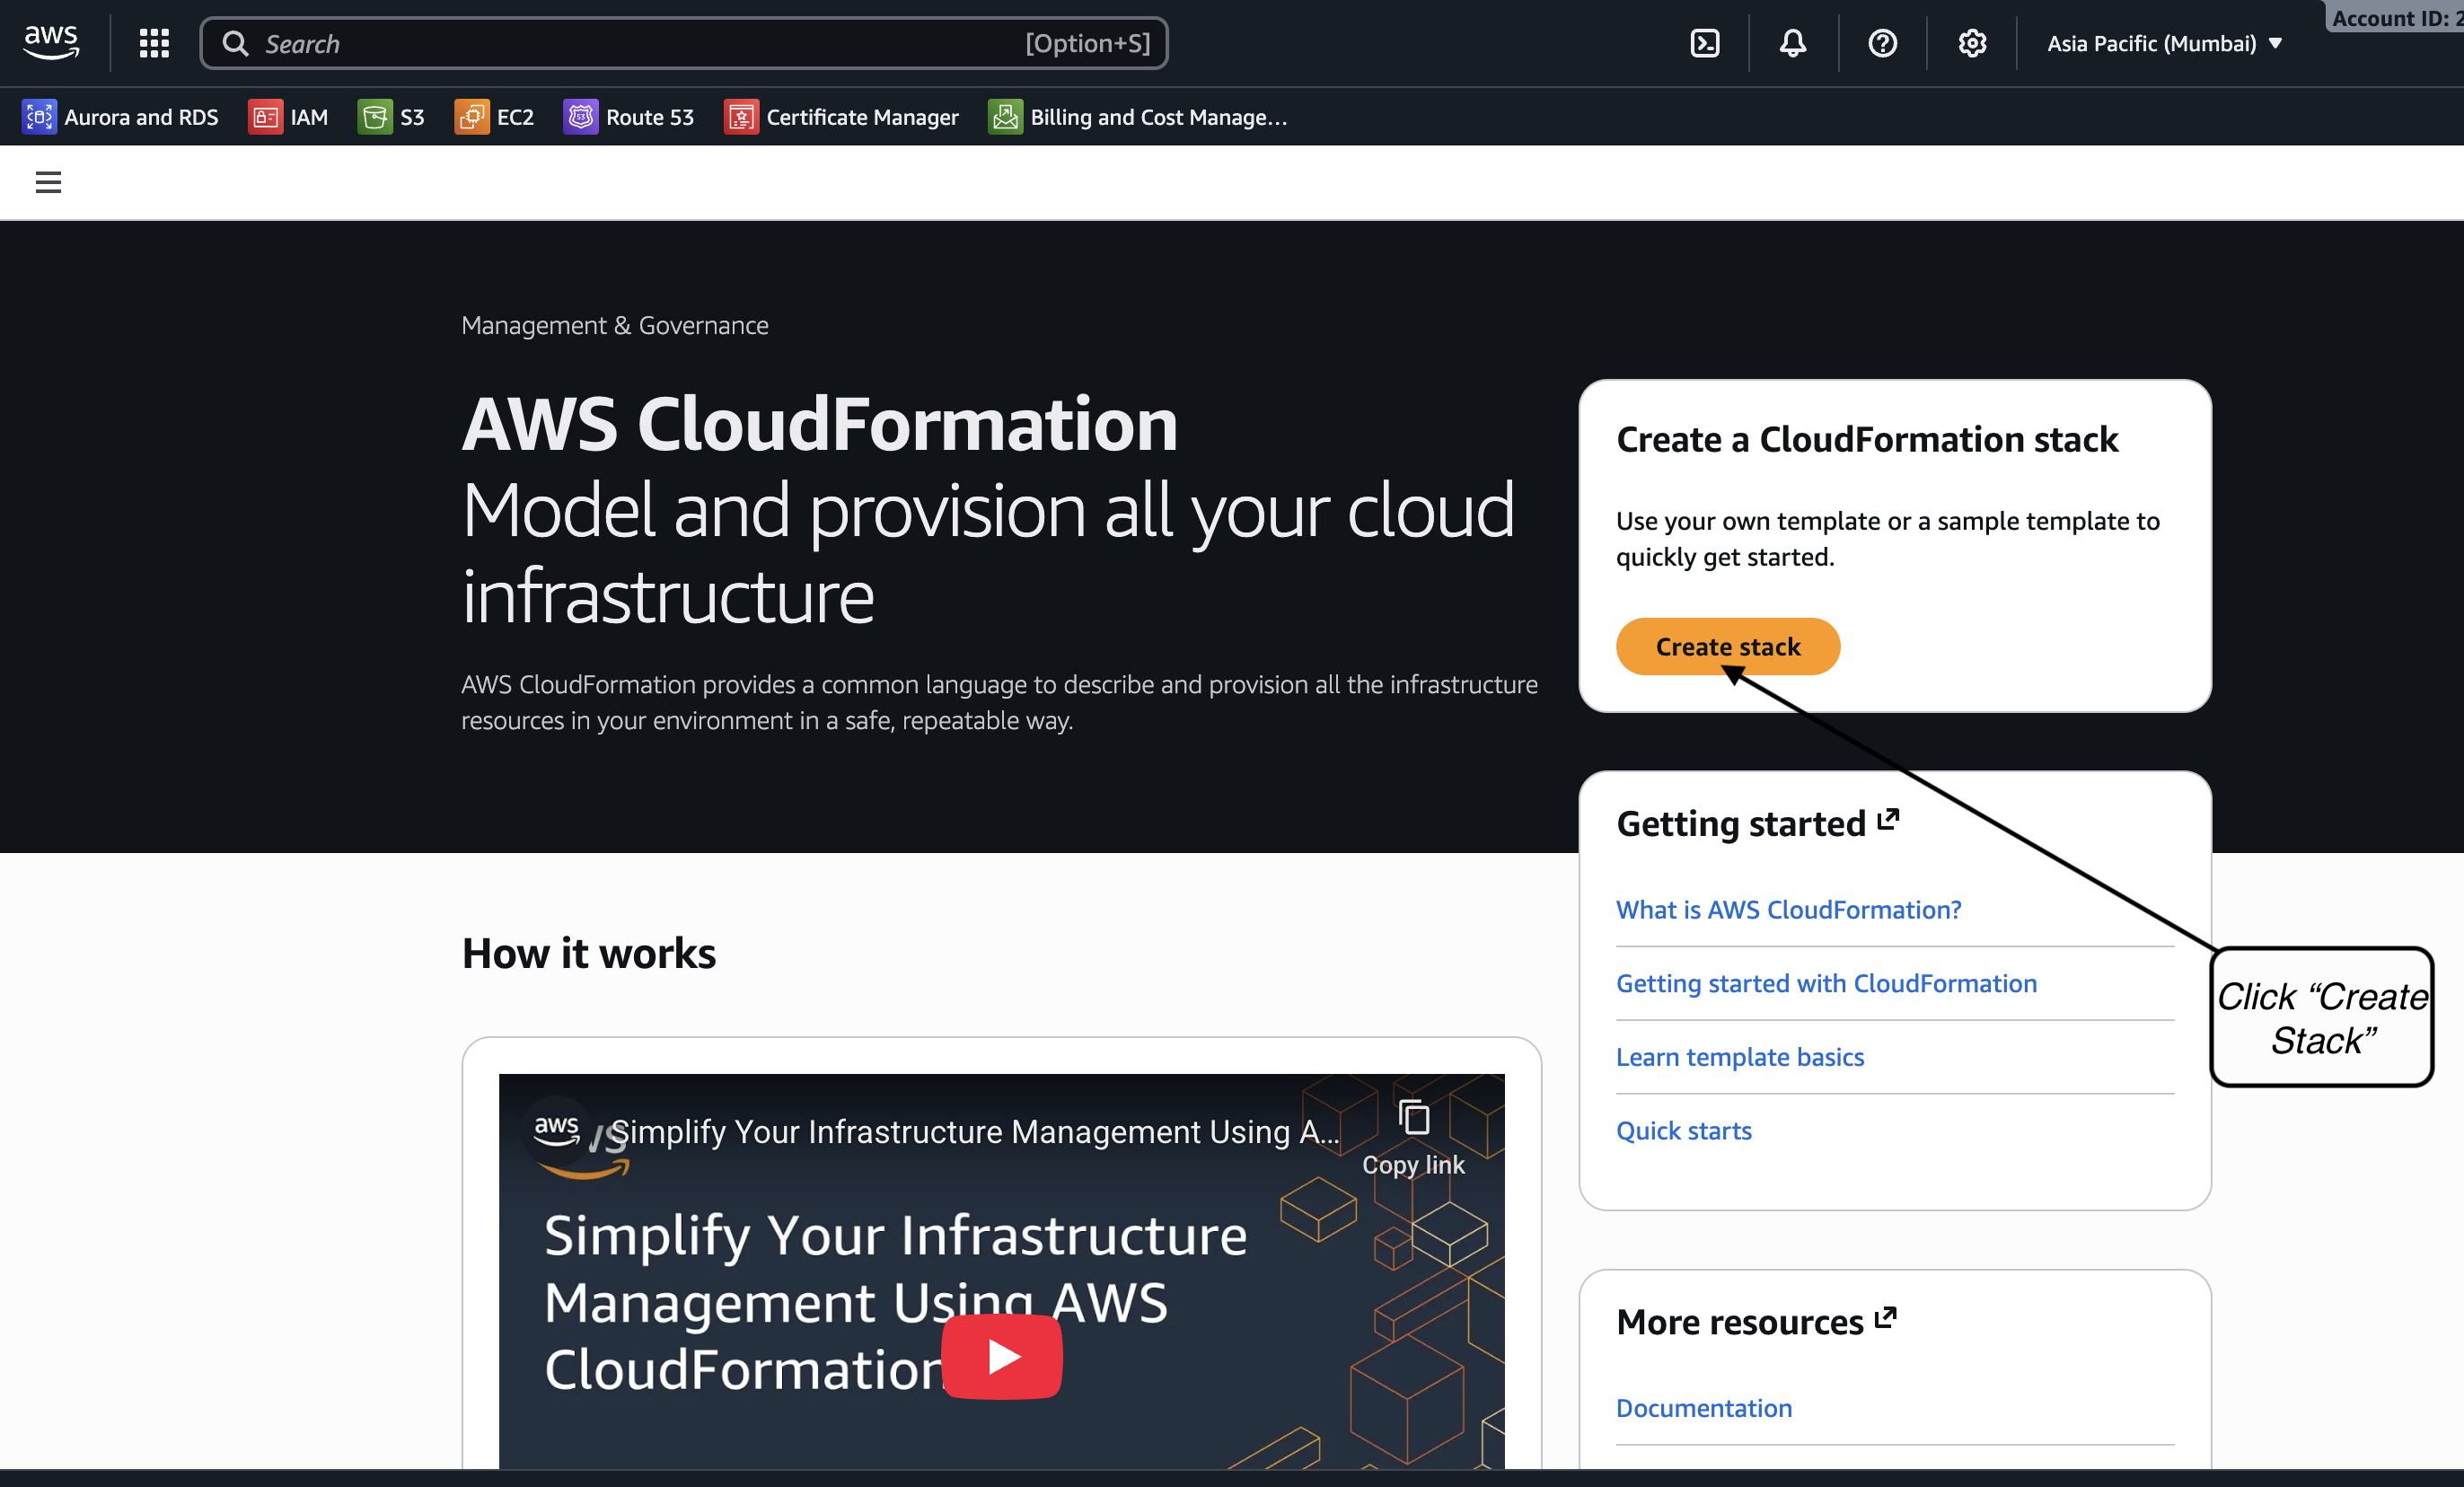
Create a Cloudformation stack which will help connect to your Cloudwatch logs.
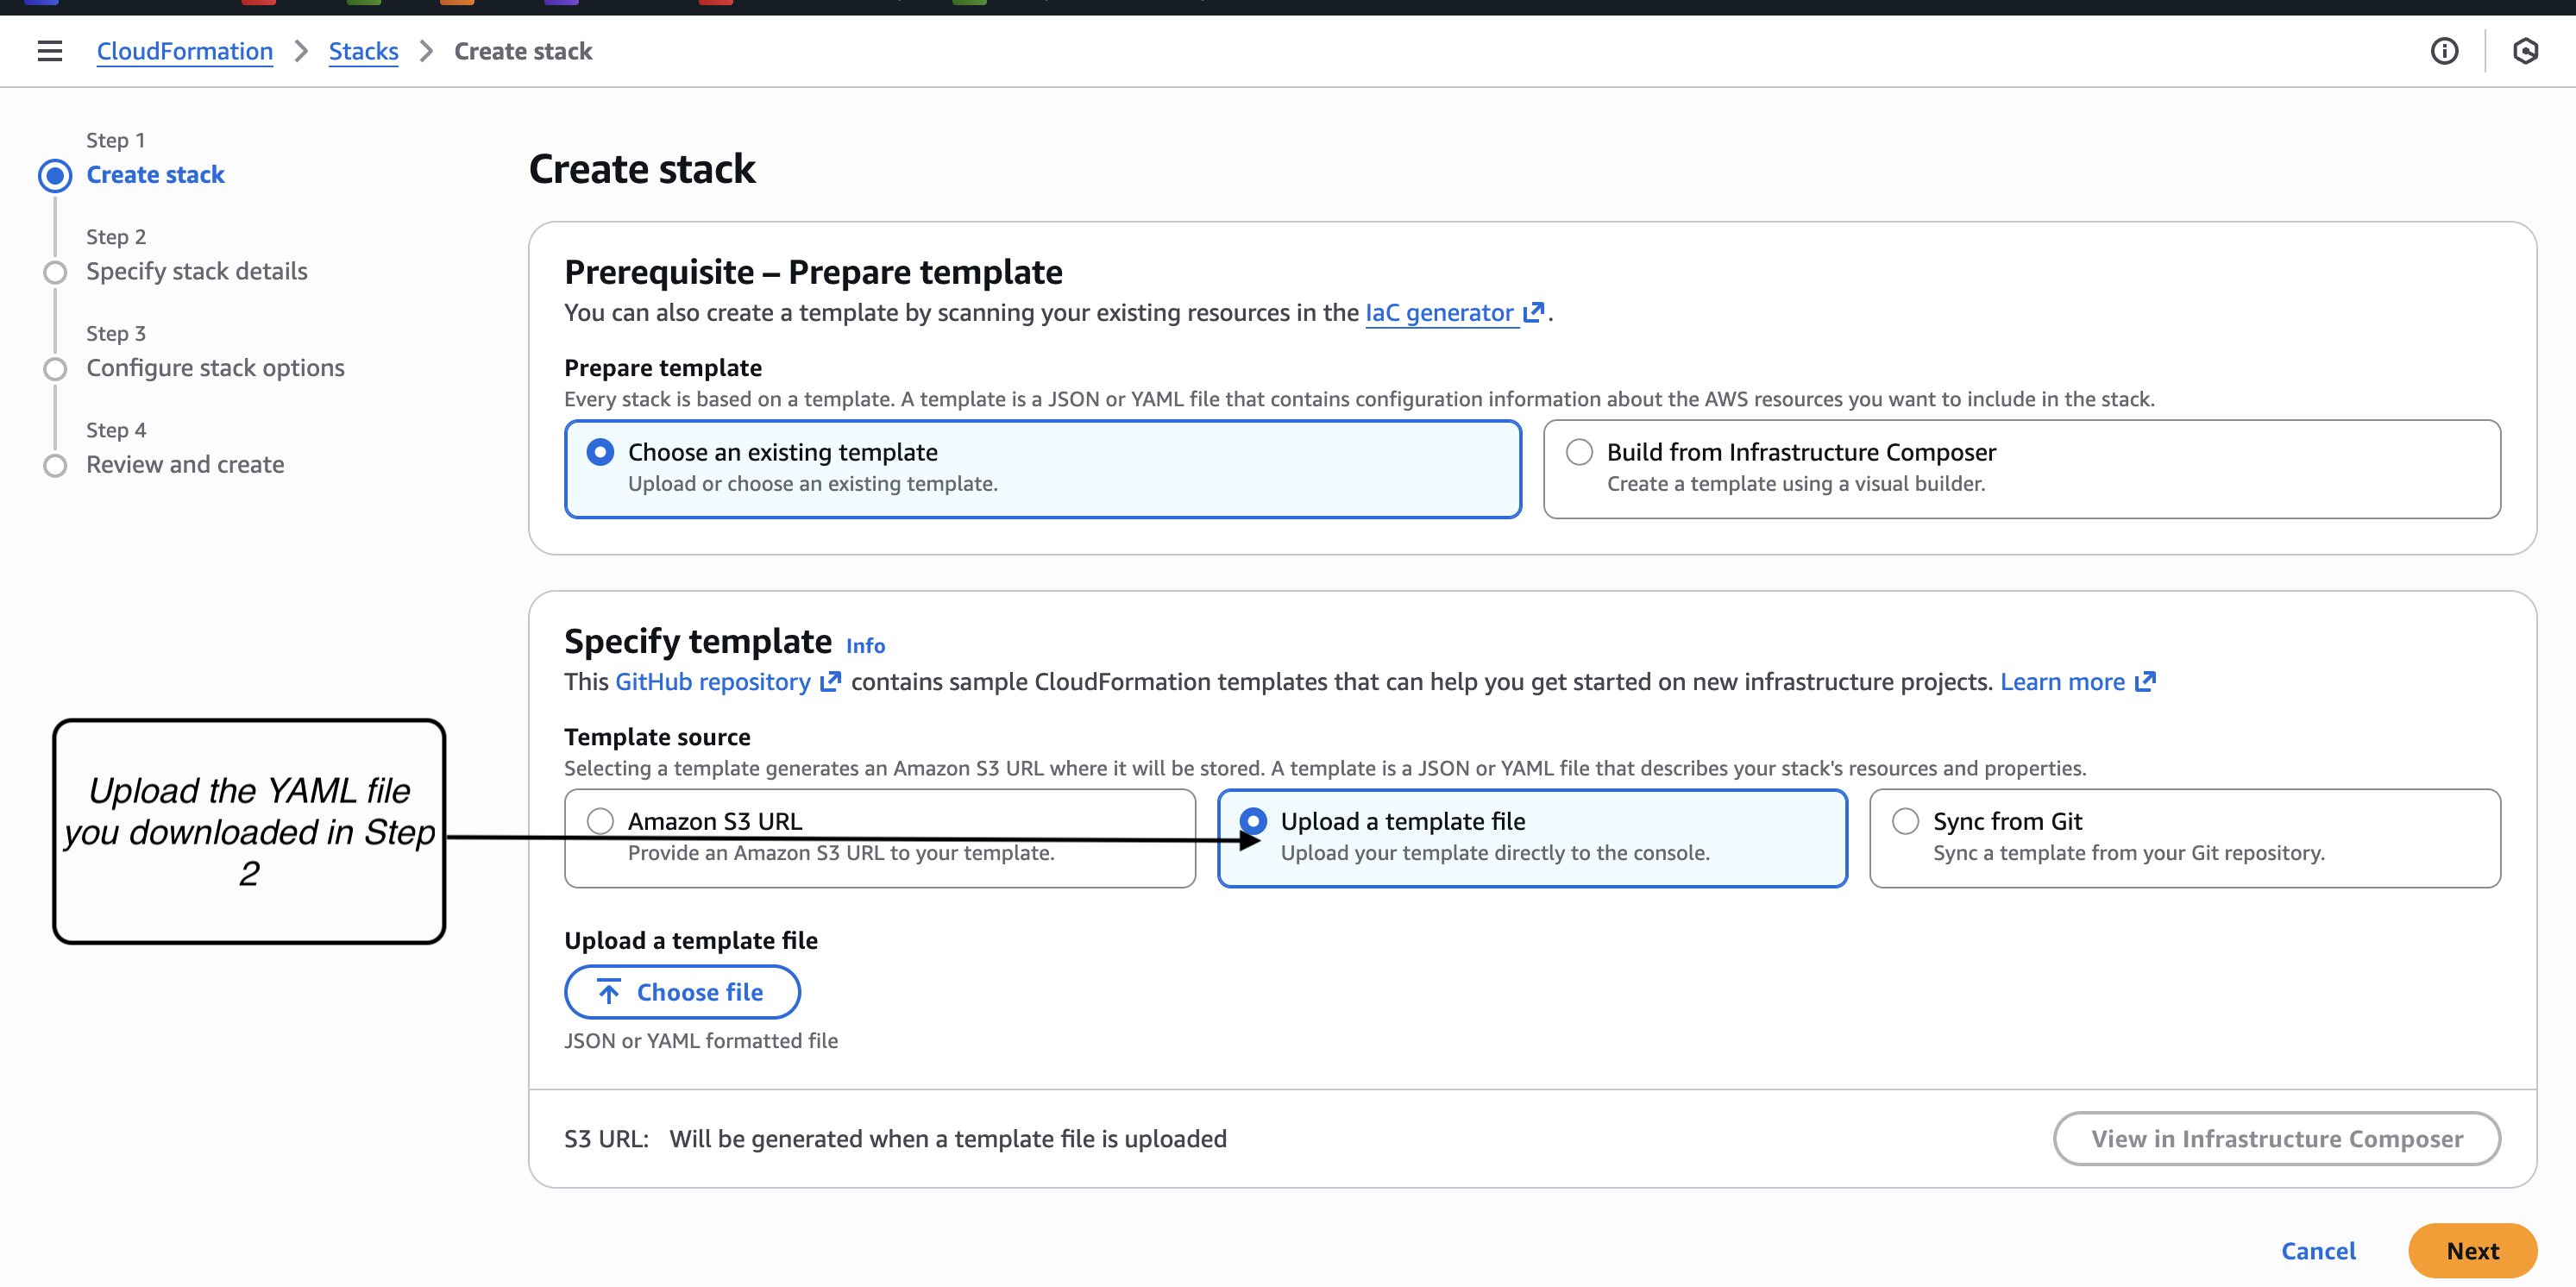
Upload the YAML file you downloaded in Step 2.
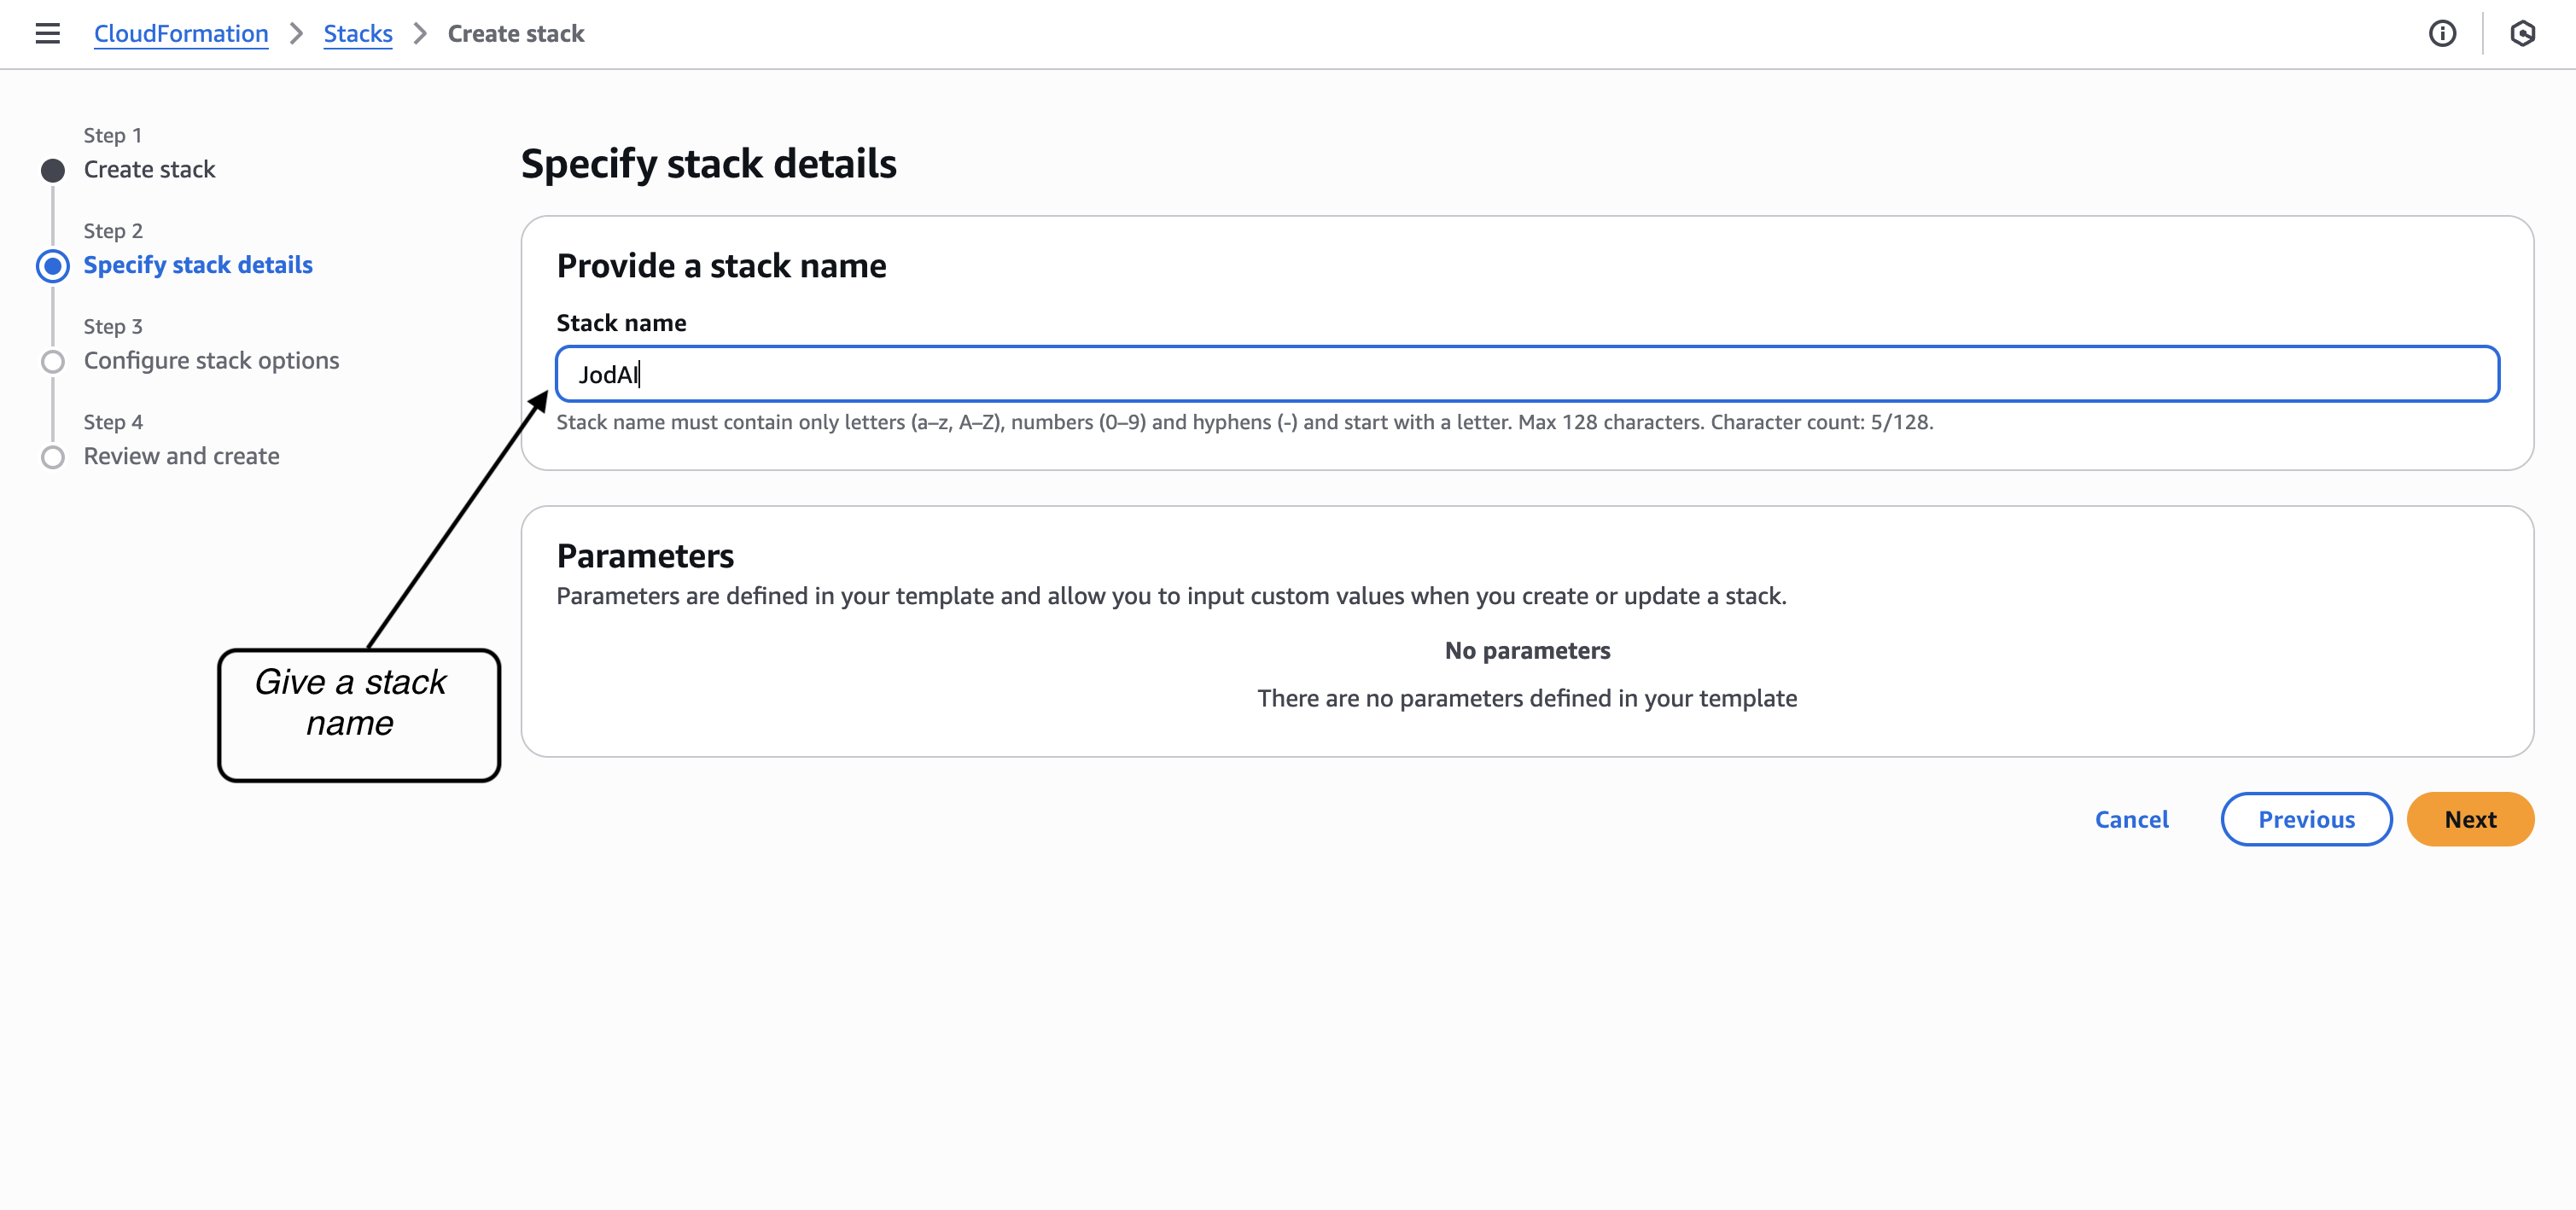
Give your stack a conducive name.
Acknowledge and click "Next".

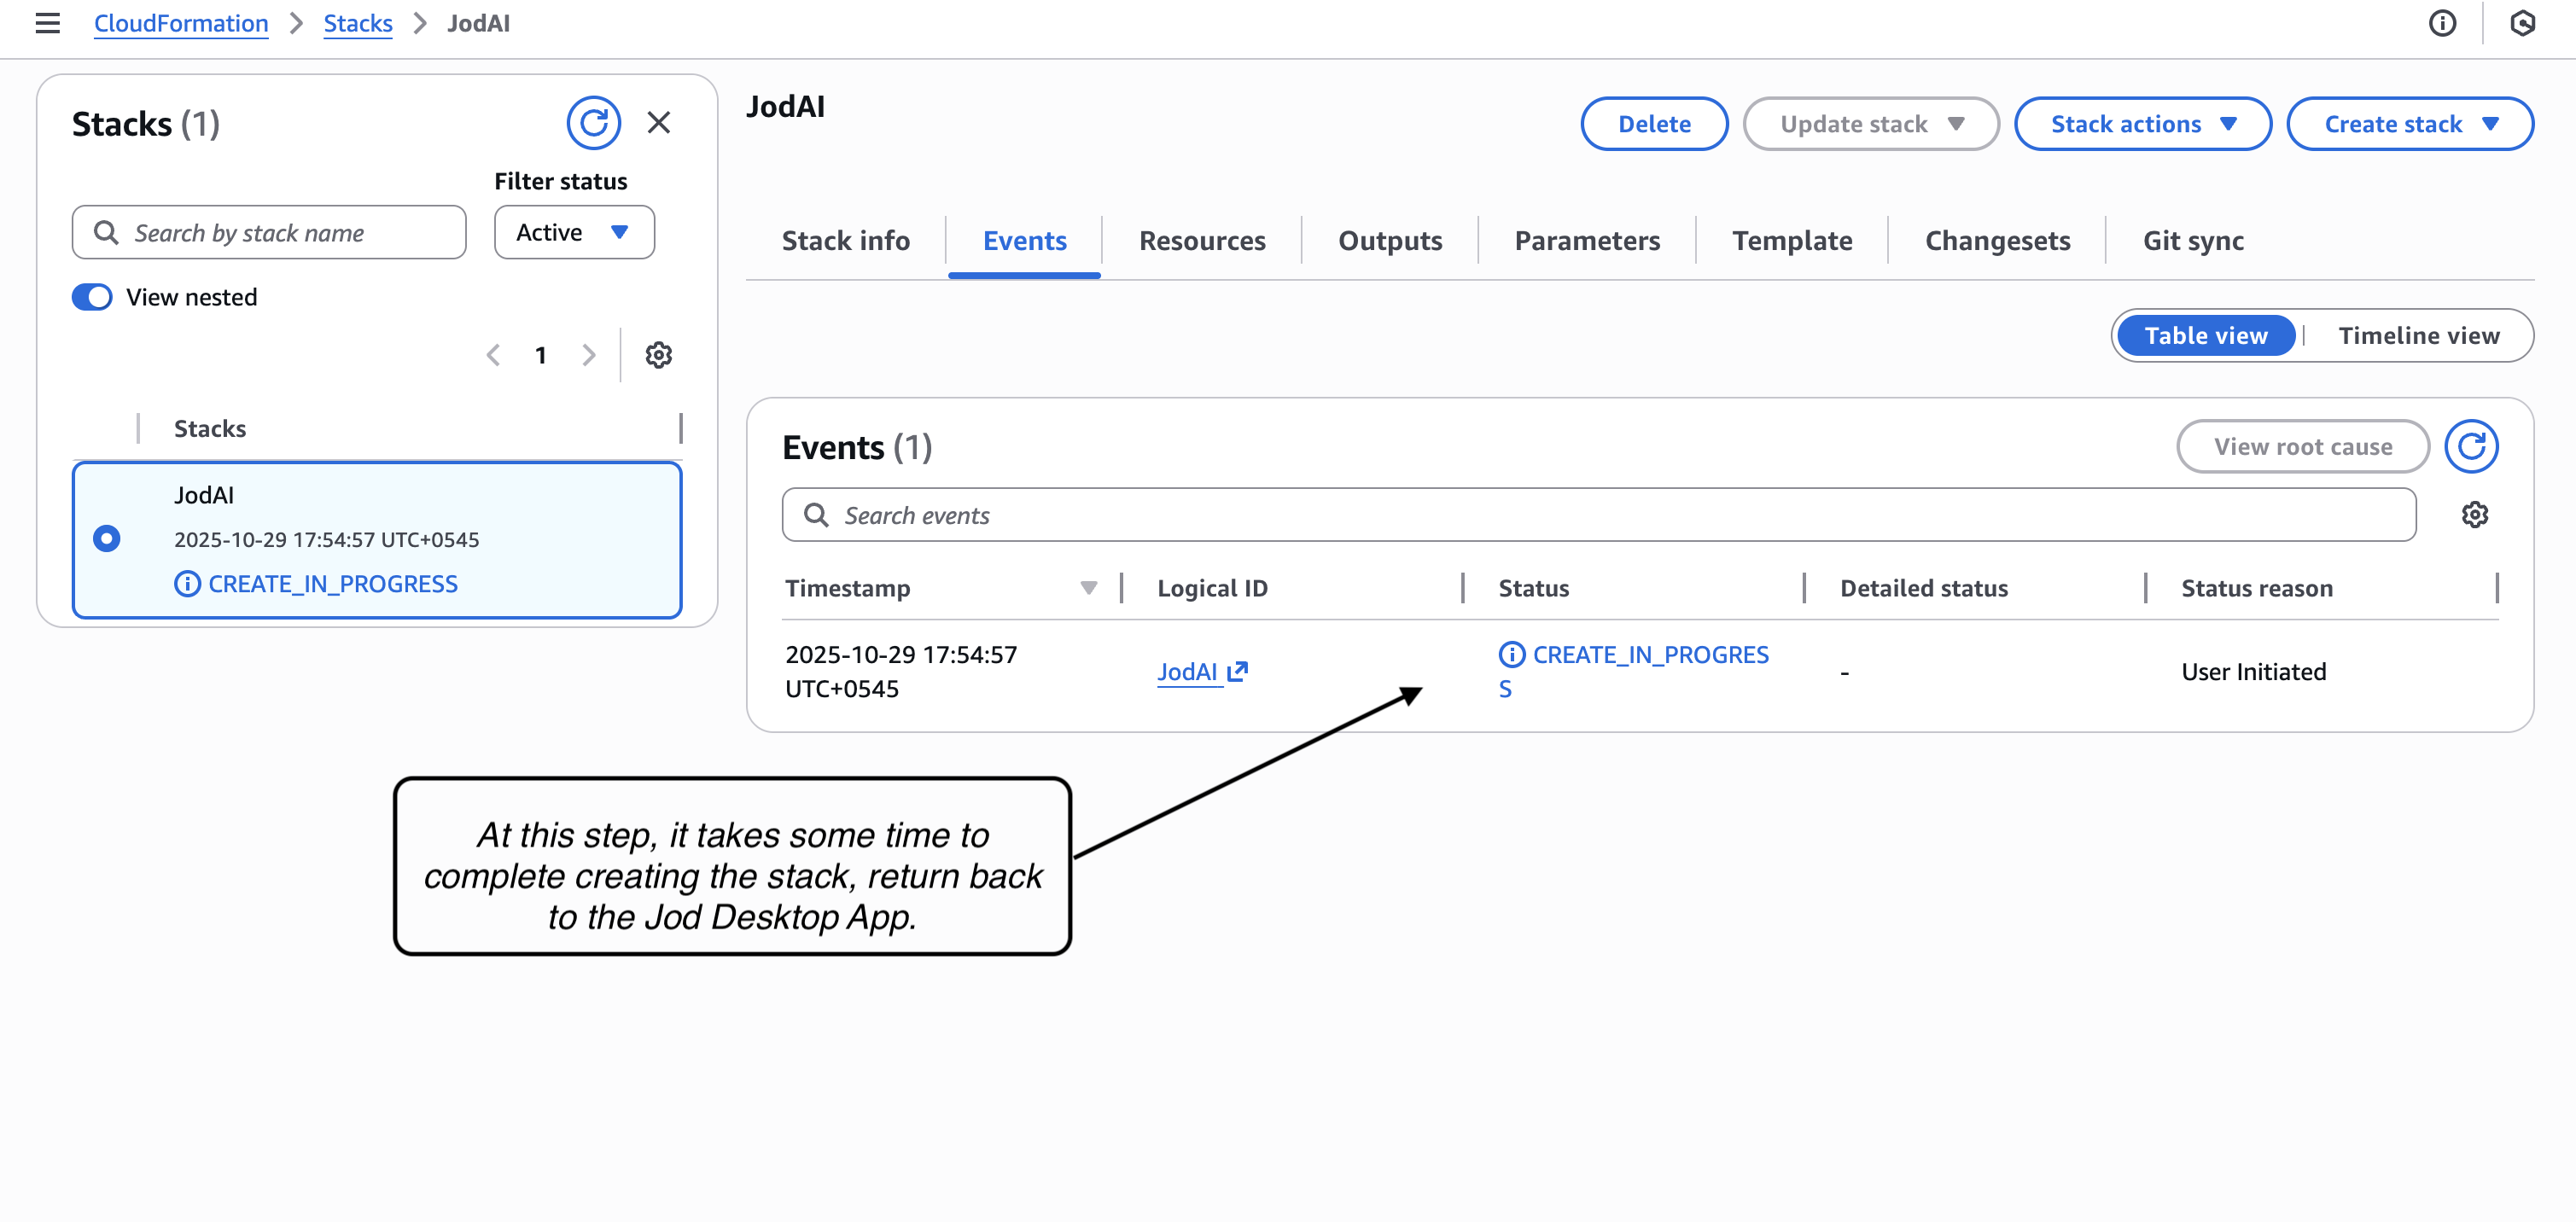
Might take few minutes for the Stack to get created. After which, please return to Jod Desktop App.
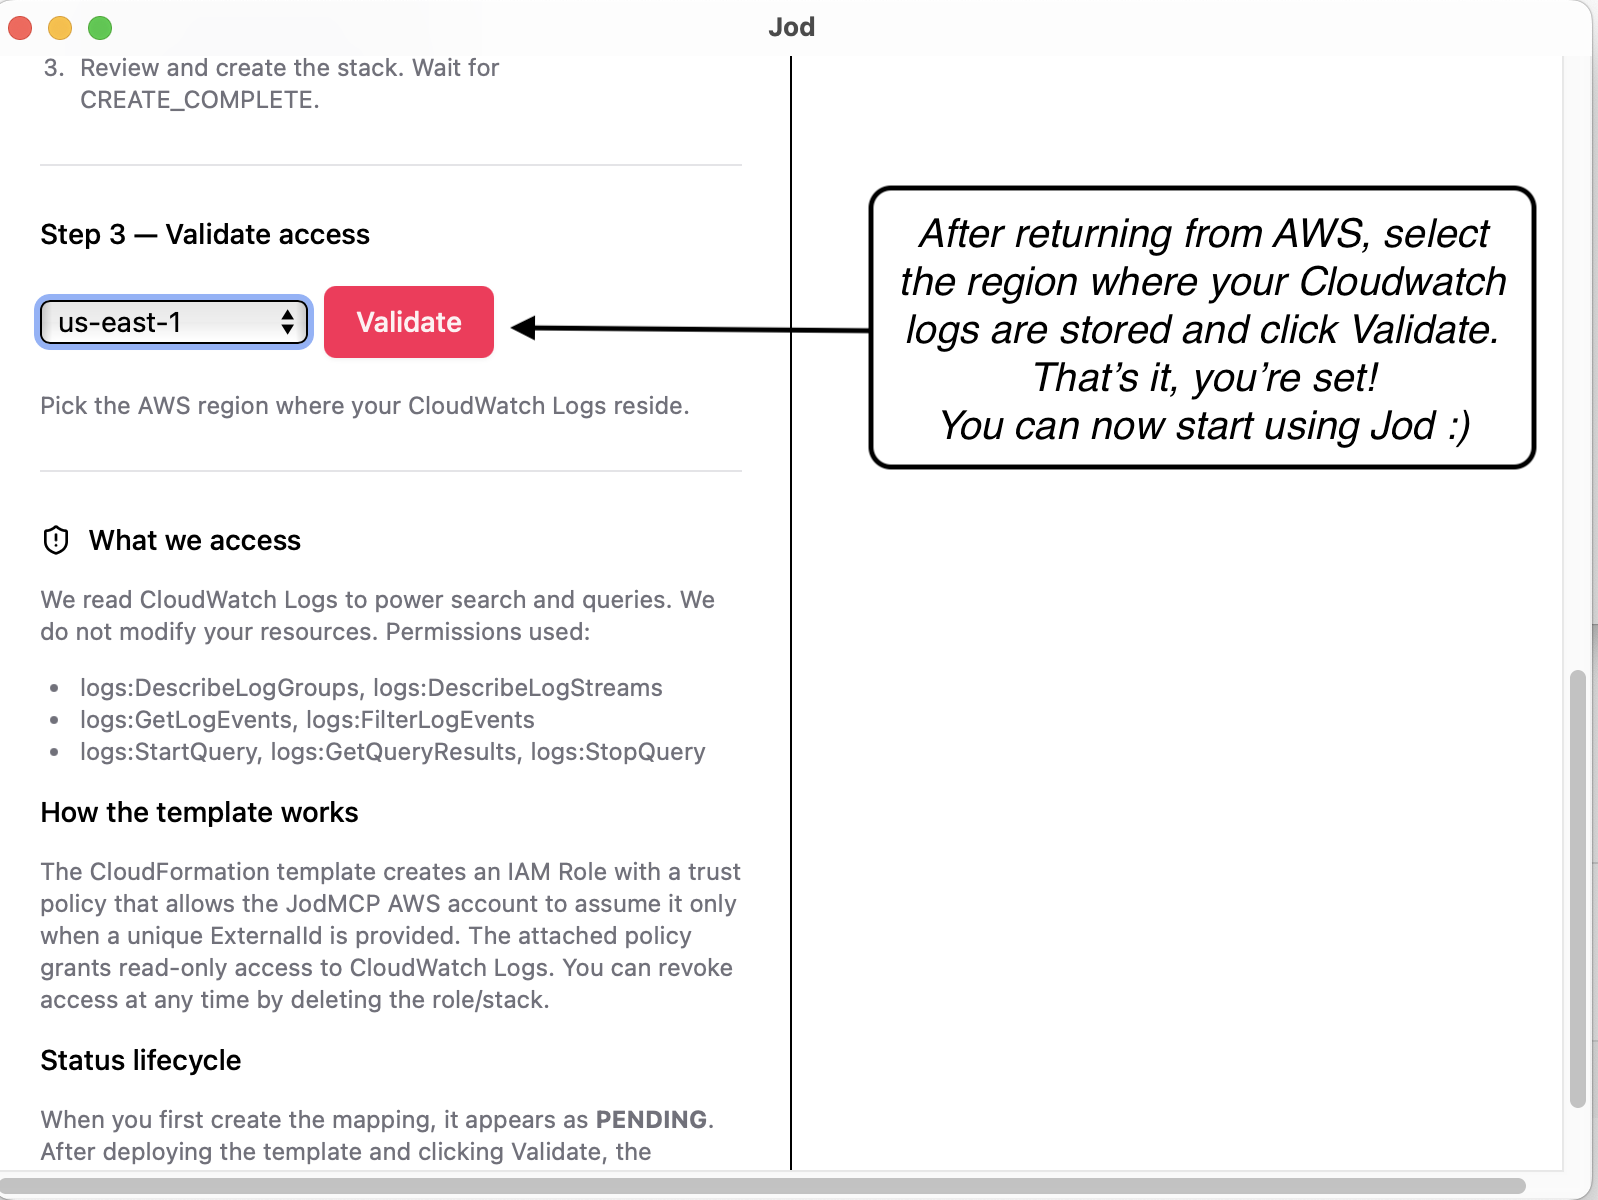
Select the region where your Cloudwatch logs are located from the dropdown and click "Validate". Now you're all set. Happy Jodding!
Here's how easy it is to query your observability data with Jod AI: